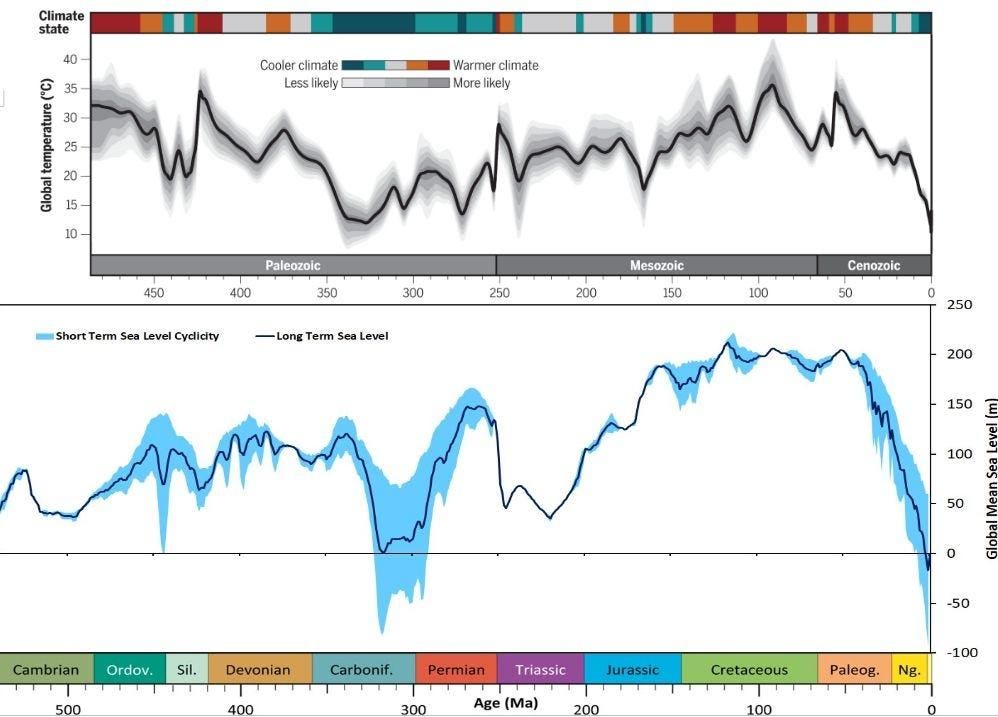
Climate curve and sea level curve
Two new studies offer the most detailed glimpse yet of how Earth’s climate and sea levels have changed during the Phanerozoic — the latest geologic eon covering the time period from 538.8 million years ago to the present.
The first curve reveals that Earth’s temperature has varied more than previously thought over much of the Phanerozoic eon and also confirms that Earth’s temperature is strongly correlated to carbon-dioxide levels in the atmosphere.
The team from Arizona compiled more than 150,000 published data points, their colleagues at the University of Bristol generated more than 850 model simulations of what Earth’s climate could have looked like at different periods based on continental position and atmospheric composition. Using special data assimilation protocolls, the different datasets were combined to create an accurate curve of how Earth’s temperature has varied over the past 485 million years.
The climate curve reveals that temperature varied more greatly than previously thought. It starts with the Hirnantian, a period of major climatic oscillation lasting from approximately 460 to around 420 million years. The coldest period in the analyzed timescale is the Karoo glaciation, lasting from approximately 360 to 260 million years. But overall, the Phanerozoic was characterized by mild to warm climates, with global mean surface temperatures spanning from 52 to 97 degrees Fahrenheit (or 11 to 36 degrees Celsius). In the warmest periods global temperatures did not drop below 77 degrees Fahrenheit (25 degrees Celsius). In the last 60 million years, after a peak during the “Cretaceous Hothouse,” Earth started to cool down. The global average temperature today is about 59 degrees Fahrenheit (15 degrees Celsius). The authors also note that the periods of extreme heat were most often linked to elevated levels of the greenhouse gas carbon-dioxide in the atmosphere.
The second curve shows how sea levels correlate both with tectonic activity – closing or opening oceanic basins and shifting continents – and the climate, determining how much water is trapped in ice caps or glaciers.
“Plate tectonics determines the depth of the oceans. If the ‘bathtub’ becomes shallower, then the water level will rise. Ice caps on continents withhold water from the ocean, but when the ice melts, the ‘bath water level’ will rise, ” explains study lead author Dr. Douwe van der Meer, guest researcher at Utrecht University.
To assess sea level changes, the scientists looked at the prevailing sediment type deposited at the time. Claystone typically forms in deeper marine settings, while sandstone is deposited in shallow basins. This preliminary curve was then combined with data derived from fossils and paleogeographic simulations, visualizing the distribution of land and sea during different geological periods.
The scientists were also able to estimate the location and volume of continental ice caps based on Earth’s changing climate over time and the position of the continents in relation to the poles.
Sea levels were relatively low during the first 400 million years, reflecting the cooler climate and low tectonic activity. During the Carboniferous (358-298 million years ago) there were very large sea level variations due to a large ice cap covering a large landmass in — called Gondwana by geologists — the southern hemisphere.
During the Cretaceous (145-66 million years ago) the supercontinent of Pangaea started to break up and the hothouse climate caused the poles to be ice free. These two effects resulted in global sea levels being more than 200 meters higher than they are at present.
In the last 60 million years Earth started to cool down and around 30 million years ago the first ice sheets started to form on the poles. In the past 2 million years during the last major ice ages sea levels dropped up to 100 meters.
The climate study, “A 485-million-year history of Earth’s surface temperature,” was published in the journal Science and can be found online here.
The sea level study, “Phanerozoic orbital-scale glacio-eustatic variability,” was published in the journal Earth and Planetary Science Letters and can be found online here.
Additional material and interviews provided by University of Utrecht.