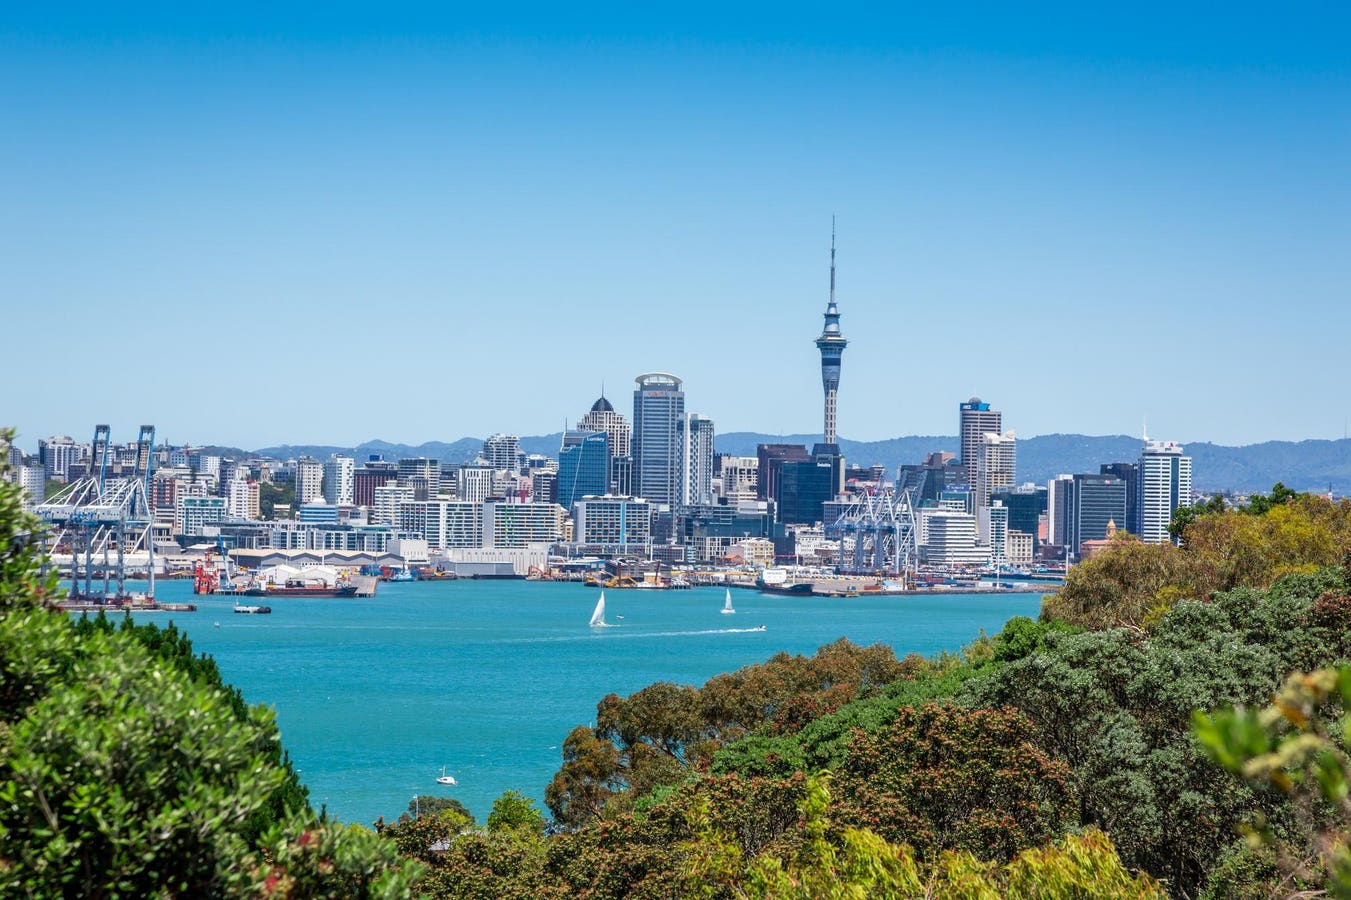
The combined effect of sea level rise and land subsidence puts densely populated areas at risk
Auckland – like most major NZ cities – sits on the coast. A combination of of sea level rise and … More
Global mean sea level has risen about 21-24 centimeters (8-9 inches) since 1880. Staggeringly, somewhere around 10 cm of that rise has happened in the past 30 years, and the rate at which sea levels are rising is accelerating – it was ~2.1 mm/year in 1993, and now it’s ~4.5 mm/year.
For coastal populations, of which there are a lot – close to 1 billion people (or ~12.5% of the world’s population) live within 10 km of a coastline – sea level rise isn’t some far off threat. Its impacts are already being felt. Storm surges during Hurricane Helene brought devastation to coastal communities across the Southeast US in 2024. Cities including NYC, and Panjin in China are increasingly experiencing floods at high tide, even in times of good weather.
No coastal city is immune to the impacts of sea-level rise. And as a new study from a group of New Zealand researchers shows, human activity is exacerbating the risk. Their analysis found that in many NZ cities, shorelines are steadily subsiding or sinking, which means that rising seas will affect them sooner.
Icebergs calving from the massive Sermeq Kujalleq glacier in Iceland. Since 1850 Sermeq Kujalleq has … More
What causes sea levels to rise?
Global sea level rise is largely driven by two factors, that in turn are a result of our warming climate. The first (and largest) contributor is the melting of ice sheets and glaciers, particularly in the polar regions. The Greenland ice sheet alone is estimated to be shedding about 270 billion tons of ice per year. The second driver is the thermal expansion of the ocean. Water, like all liquids, expand when they’re heated. And more than 90% of the heat trapped in our atmosphere – thanks to an accumulation of greenhouse gases – is eventually absorbed by our oceans. A warmer ocean takes up more space than a cooler one, and so we’re seeing higher sea levels. This effect is estimated to cause roughly one-third of the global sea-level rise observed by satellites since 2004.
However, there are other causes that are far more localized. The land itself may be sinking (or lifting), either as a result of tectonic activity, or of human activity – namely, groundwater extraction, dredging, and land reclamation. These activities can “potentially double or triple the effects of sea-level rise in certain places,” writes Dr Jesse Kearse, a Postdoctoral Researcher at Kyoto University.
Here in Aotearoa NZ, the effects of these land changes on urban areas have been examined in detail for the first time. The results paint a rather worrying picture for our coastal infrastructure.
This map shows vertical land movement (VLM) in Dunedin. The darker blue colors highlight parts of … More
Measuring the coastal strip from space
Kearse is the lead author of this new paper, and an expert on measuring vertical land motion using a satellite-based mapping technique called InSAR (Interferometric Synthetic Aperture Radar).
“InSAR allows us to map ground deformation using radar images of the earth’s surface,” he explains, speaking over Zoom from Japan. “It’s an active source imaging system – it’s not about passively collecting reflected light like you do for optical images. The radar signal is beamed down from a satellite, it hits the surface and reflects back.”
The radar satellite used by Kearse and his colleagues is called Sentinel-1. For the past decade, it has been continuously collecting radar imagery of our planet, and making it available via the European Space Agency’s database. It’s been used to monitor everything from marine winds to soil moisture, and for emergency responses. Unlike optical satellites, SAR can see through clouds and operate both day and night.
Captured within a radar image are two pieces of information: amplitude and phase. You can think of the amplitude as the strength of the return signal – it is influenced by the physical properties of the surface. But if you’re interested in measuring ground deformation, phase is the useful part. Radar waves have a specific wavelength, “around five centimeters” in the case of Sentinel-1, so the distance from the satellite to the ground and back again can be expressed in terms of that wavelength (distance = some number of full wavelengths plus some fraction of a wavelength).
When you compare two images of the same area taken on different dates, anywhere that you find extra or fewer fractions of a wavelength (i.e. a change in phase) will likely be a spot where the ground has changed its vertical position between those images – it may have subsided or lifted, relative to the ground around it. Phase differences can be measured with very high accuracy.
To turn those relative measurements of vertical motion into true or absolute measurements, you need to use a reference – ideally sensors on the ground within the same area that can also measure small ground movements. New Zealand already has a network of suitable sensors. Called GeoNet, it acts as a geological hazard monitoring system, and it continuously collects ground deformation data from its GNSS stations around the country.
Wellington Airport, as seen from the air. Its construction involved the removal of an entire hill; … More
Sinking kiwi cities
The combination of high-resolution InSAR data and GeoNet’s GNSS data allowed Kearse and his colleagues to measure vertical land movement between 2018 and 2021 at major urban coastal strips around the country; namely, Auckland, Tauranga, Wellington, Christchurch, and Dunedin. Together, these areas are home to the majority of the population.
“One of our main conclusions was that the coastal strip is going down consistently in all of these cities, and it’s happening at a rate of a few millimeters each year,” Kearse says. In terms of numbers, they found that 77% of NZ’s urban coastlines are subsiding at rates of 0.5 mm/yr or more. Some of the fastest subsidence rates – more than 3.0 mm/yr – were measured in the coastal suburbs of Christchurch.
They also identified highly-localized hotspots, with subsidence rates exceeding 15 mm/yr in some cases. “These human-modified parts of the coastline are going down at locally much faster rates than the rest of the coast, which in turn is going down faster than the inland areas,” he says. While the researchers didn’t delve into the cause of these subsidence hotspots in this paper, Kearse has noticed a pattern. “There’s a lot of reclaimed land in New Zealand cities – some of it you cannot detect, and some stands out really clearly in the images. I’m not an engineer, but the methodology or the engineering approach that was used to reclaim the land seems to have a significant effect on its current stability.”
In the interview, he gives the example of Wellington Airport whose construction required the movement of “three million cubic meters of earth and rock”, as well as significant land reclamation. “That was a huge engineering effort. A lot of research, a lot of care and attention was paid to that construction,” says Kearse, “and it remains very stable. But then you have areas like Naval Point [in Christchurch] which is very different. That land was reclaimed by ring-fencing an area and just filling it up with a very fine-grained material. It started subsiding early on, and the response then was just to add more material.” Kearse’s data shows that reclaimed land at Naval Point is still subsiding, at a rate of up to 6.5 mm/yr. If sustained, this amounts to 65 cm of sea-level rise per century – enough to threaten most coastal defenses.
New Zealand’s status as ‘the shaky isles’ makes it difficult to study land subsidence.
The shaky isles
Many of the subsiding areas are home to heavy industries, ports and other critical infrastructure like wastewater treatment plants. When asked how worried the public should be about this in the coming decades, Kearse says, “I think that’s a bit outside of my expertise, but my personal opinion is that there are still a lot of unanswered questions in terms of what’s actually going on. Are these subsidence rates going to persist for decades to centuries? It’s not clear.”
Something that complicates the picture is the fact that New Zealand is one of the most seismically-active areas on the planet. It straddles the boundary of two tectonic plates – the Pacific plate and the Australian plate. At the bottom of the South Island (Te Waipounamu), the Australian Plate dives, or subducts, below the Pacific plate. Just off the east coast of the North Island (Te Ika-a-Māui), the situation is reversed – there, the Pacific plate plunges below the Australian one. Wellington’s location along the plate boundary means that it can experience large, sudden quakes as well as ‘slow-slip events’, where faults can move over a period of weeks or months. This complexity is “really problematic for trying to understand long-term vertical land motion in the capital city,” says Kearse “In inter-slow-slip time periods, the whole subduction system pulls Wellington down by about 3 mm a year. And then for a few months that will rebound and it might regain 50 or 60% of that accumulated subsidence. And then the cycle will repeat again.”
Kearse says that he found no evidence of land subsidence accelerating in recent years – “in most cases, it was either pretty steady or even decelerating” – but he reemphasized the paper’s conclusions, saying “Vertical land motion has to be considered in any assessment of sea level rise, and in any future development plans for those vulnerable urban areas.”