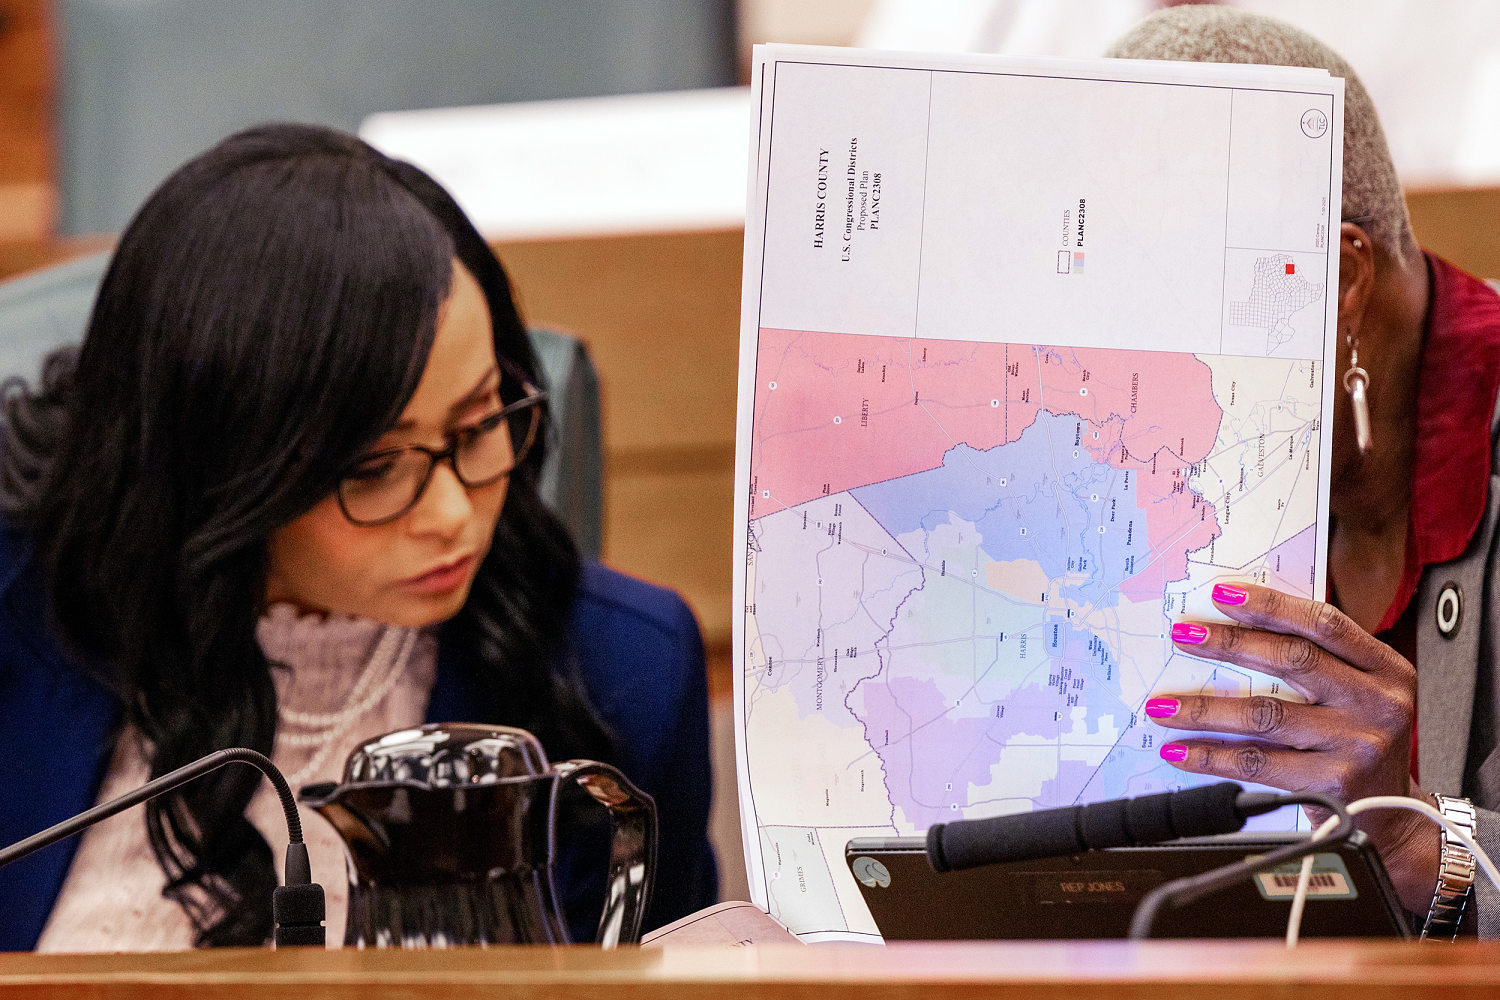
Texas Republicans’ move to redraw their congressional map mid-decade and Democrats’ retaliatory redistricting efforts have captured national attention for a very simple reason: How House districts are drawn can shape American politics for years.
Gerrymandering generally reduces the number of competitive races, and it can lock in nearly immovable advantages for one party or another. Under the new map proposed in Texas, no seat’s presidential vote would have been decided by single digits in 2024, and Republicans would have a path to pad their narrow congressional majority in the 2026 midterm elections. This means more people could reside in congressional districts under solid control of one party.
NBC News analyzed how the question of who draws the maps — and how they do it — can shape elections for years afterward.
The difference between safe seats and competitive districts
Who draws district lines can make the difference between contested general elections in a state in November and elections that are barely more than formalities.
NBC News analyzed every House race in the country from 2012 to 2020, the last full 10-year redistricting cycle, based on how each district was drawn. In states where state legislators drew the maps, single-digit races (elections in which the winners won by less than 10 percentage points) were rarest. Only 10.7% of House races fell into that competitive category.
There are plenty of reasons that don’t involve gerrymandering. For one thing, voters of both parties have increasingly clustered in recent years, leaving fewer places around the country that are politically divided.
Still, gerrymandering does play a significant role. When commissions or state or federal courts drew the lines last decade, the rate of competitive elections jumped, though safe seats are still overwhelmingly likely. Competitive elections were especially prevalent in states with court-drawn districts: 18.1% of races in those states had single-digit margins from 2012 through 2020.
A look at Pennsylvania, whose legislative-drawn map was thrown out and replaced in 2018 by the state Supreme Court, illustrates the dramatic change that can come based on who draws congressional lines. The same state with the same voters living in the same places suddenly had many more competitive elections.
From 2012 through 2016, just three of Pennsylvania’s 54 House general elections under the initial map had single-digit margins.
After the state Supreme Court threw out the map and imposed a new one, the number of battleground races bumped up. Eight of 36 House races had single-digit margins in 2018 and 2020.
Meanwhile, ahead of the 2026 midterms, The Cook Political Report with Amy Walter rates 40 House districts as toss-ups or slightly leaning toward one party. More than half (23) of those 40 competitive districts are in states where commissions or courts drew the maps.
How a state’s partisanship compares with whom it sends to Congress
The power of the redistricting process can bend a state’s representation in Congress away from its overall partisanship, with wide differences between the statewide vote in some states and the makeup of their House delegations.
Take Illinois, for example, where Donald Trump got 44% of the vote in 2024. Republicans hold only three of the state’s 17 seats in Congress, or 18%. (NBC News is looking at presidential data instead of House data here because some races are uncontested.) And even though Trump got 38% of the vote in California last year, Republicans hold only 17% — that’s nine seats — of the state’s 52 congressional districts.
On the other side of the ledger, Trump got 58% support in South Carolina last year, and 86% of the state’s House delegation is Republican. In North Carolina, 51% voted for Trump last year, and Republicans have 71% of the delegation.
The comparison between House seats and presidential election performance isn’t perfect. But it demonstrates that how district lines are drawn can generate different results from what statewide results might suggest.
Right in the middle of the chart is Virginia. Its 11 congressional districts split 6-5 for Democrats, meaning Republicans hold nearly 46% of the state’s seats in Congress, and Trump won 46% of the vote in Virginia last year.
Also, just because a state’s maps favor one party compared with the statewide results after one election doesn’t mean the redistricting process was biased. Tightly divided Pennsylvania has seven Democrats and 10 Republicans in Congress, and three GOP-held districts are rated as toss-up or lean-Republican races in 2026, according to the Cook Political Report.
Each state charts its own course
Since each state is responsible for handling its own redistricting, the process is different depending on where you look, giving immense power to different institutions state by state.
In 27 states, legislatures approved the maps. In seven, independent commissions approved them, seven had court-approved maps, two had political commissions, and one state’s maps were approved by a backup commission, according to data from Loyola Law School. (The six states that elect only one person to the House don’t draw new congressional maps.)
Loyola Law School’s “All About Redistricting” website defines politician commissions as panels elected officials can serve on as members. The website defines backup commissions as backup procedures if legislatures can’t agree on new lines.
Some independent redistricting commissions aren’t as powerful as those in other states. New York has an independent commission, but the Legislature overrode its map and passed its own in 2024.


